Your browser’s native developer tools are a great way to test third-party tags (Google Analytics, Display/Social Pixels) if you’re unable to (or don’t want to) add extensions such as Google Tag Assistant or Ghostery to your browser.
All browser’s developer tools work in the same way, when visible on a page they collect debug information in the console (such as JavaScript warnings and errors), keep a log of all requests made by the webpage and the resources it loads (as well as much more).
If you have tags that you want to debug through these tools, follow the below steps.
- Navigate to the page you want to test
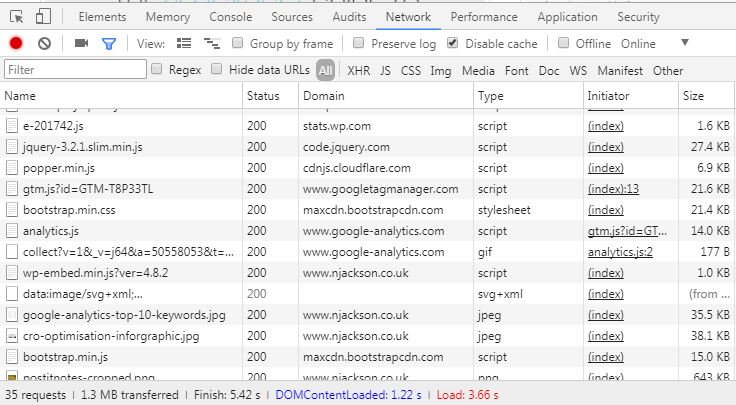
- Open your browser’s dev tools and switch to the ‘Network’ tab
- In Chrome – Ctrl+Shift+i
- In Firefox/IE – Right click and click “Inspect Element”
- In Opera – Ctrl+Shift+c
- Reload the page
- Check the path and domain columns (if you can’t see one of these columns, right-click the table heading and enable it) for a request made to the tag you’re testing
- Click the request to show more details on what requests and response the request had
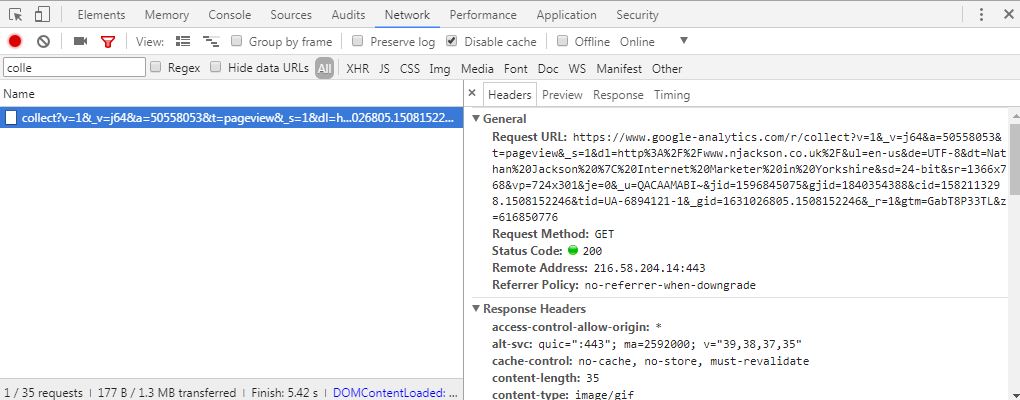
- Follow the redirects through until no more redirects happen, and it should end with a 200 response
Additional considerations
- Analytics with remarketing and advertiser features enabled can cause the redirect to go through DoubleClick and Google Ad Services domains
- HSTS upgrades requests from HTTP to HTTPS for some tag providers
- Some tags may not respond with a 200 (Ok) HTTP status code, but as long as it’s not a 404 (Or another 4xx code) your probably fine. If in doubt, check with the tag’s provider.
- If the tag has a JavaScript syntax error, it may not even make an HTTP request, so if you can’t find it so far, check the Console (In the developer tools) to see if there’s an error.
How to know which path and domain name to look for
If you aren’t the person who added the tags, or you’re not sure which path or domain to look for, there are a few places you should check.
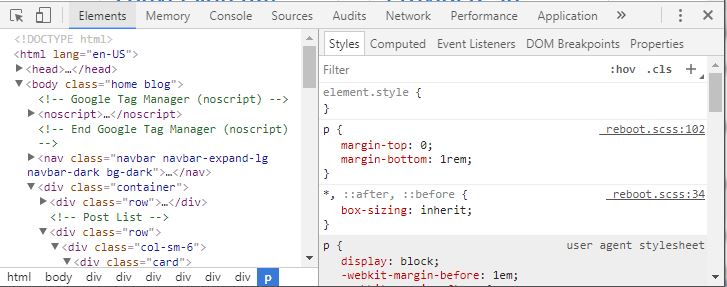
- The page’s source code by right clicking on the page (not on an image as it will change the contents of the right-click menu)
and click ‘View page source’ (or similar). Then press Ctrl+F and start searching - Your tag management platform. Navigate to the tag and look for which domain name the tag has in its code
- The DOM (the processed source code, with all current state of HTML that you can see) by going to the ‘Elements’ tab of the developer tools, press Ctrl+F and start searching
If you can’t see any signs of your tags, they may not be deployed yet!
Feel free to leave a comment or a question below!